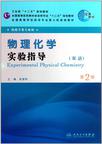
物理化学实验指导
当前位置:首页 > 教材 > 研究生/本专科 > 物理化学实验指导
出版社:人民卫生出版社
出版日期:2007-7
ISBN:9787117144391
作者:崔黎丽 编
页数:148页
作者简介
《卫生部"十二五"规划教材•全国高等医药教材建设研究会"十二五"规划教材•全国高等学校药学专业第七轮规划教材:物理化学实验指导(双语)(第2版)(供药学类专业用)》分为三个部分:(1)绪论,主要介绍物理化学实验课程的目的和要求、实验报告书写规则、实验室安全知识、误差理论和有效数字、实验数据的表示与处理,以及物理化学实验的设计思想;(2)实验部分,在汲取参编院校长期实验教学经验的基础上,选编了热力学、相平衡、电化学、动力学、表面和胶体化学等物理化学分支中有代表性且较成熟的实验。此外,还编写了部分综合、设计性实验,在强化基础知识、基本技能训练的基础上,培养学生动手能力、创新思维能力和科学素养,培养学生分析问题和解决问题的能力;(3)附录部分,收录一些常用数据表以便查阅。
书籍目录
第一部分  绪论(Part One  Introduction)
    一、物理化学实验的目的和要求
    二、物理化学实验的安全知识
    三、物理化学实验的设计思想
    四、误差理论和有效数字
    五、实验数据的表示法和处理
    1.Objective and requirement
    2.Physical chemistry laboratory safety
    3.Rules for designing of the physical chemistry experiment
    4.Error theory and significant figures
    5.Data reporting
第二部分  实验(Part Two Experjments)
  实验一 燃烧热的测定
  Experiment 1 Heats Of Combustion
  实验二 溶解热的测定
  Expenment 2 Heats of Solution
  实验三 凝固点降低法测定摩尔质量和渗透压
  Experiment 3 Molar Mass and Osmotic:Pressure by Freezing Point
Depression
  实验四 液体饱和蒸气压的测定
  Expenment 4 Saturated Vapor Pressure of Pure LJquids
  实验五 反应平衡常数及分配系数的测定
  Expenment 5 Equilibrium Constant 0f Reaction and PaItitiml
Coefficient
  实验六 完全互溶双液系平衡相图的绘制
  Expenment 6 Phase Diagram of a Miscible Binary Liquid Svstem
  实验七 双组分简单低共熔体系相图的绘制
  Expenment 7 Solid-liquid Binary Phase Diagram
  实验八 三组分液-液系统相图的绘制
  Experiment 8 A Ternary Phase Diagram for a System of Three
Liquids
  实验九 电解质水溶液电导的测定及应用
  Experiment 9 Measurement and Application of Electrolyte Solution
    Conductance
  实验十 电动势法测溶液pH和反应热力学函数
  Experiment 10 Determinations of pH of Solution and Thermodynamic
Functions
    by Electromotive Force Measurements
  实验十一 一级反应速率常数的测定
  Experiment 11 Rate Constant for First Order Reaction
  实验十二 碘化钾与过氧化氢反应的速率常数及活化能的测定
  Experiment 12 Kinetics of Reaction between Potassium Iodide and
Hydrogen
    Peroxide
  实验十三 丙酮溴化反应速率常数的测定
  Experiment 13 Rate Constant and Activation Energy of the
Bromination of
    Acetone
  实验十四 乙酸乙酯皂化反应速率常数及活化能的测定
  Experiment 14 Rate Constant for the Saponification of Ethyl
Acetate by
    Conductometric Method
  实验十五 最大泡压法测定溶液的表面张力
  Experiment 15 Surface Tension of Solutions by Bubble Pressure
Method
  实验十六 固体在溶液中的吸附
  Experiment 16 Adsorption of Solids in Solution
  实验十七 乳状液的制备和性质
  Experiment 17 Preparation and Properties of Emulsion
  实验十八 溶胶的制备及性质
  Experiment 18 Preparation and Properties of Sols
  实验十九 黏度法测定大分子的平均相对分子质量
  Experiment 19 Average Relative Molar Mass of the Macromolecule by
    Viscosity Method
  实验二十 纳米材料的合成与表征(综合设计性试验)
  Experiment 20 Preparation and Characterization of Nanomaterials
    (Multi—designing Experiment)
  实验二十一 药物稳定性及有效期测定(设计性实验)
  Experiment 21 Determination of Drug Stability and Shelf Life
     (Designing Experiment)
  实验二十二 固体药物常规理化常数的测定(综合设计性实验)
Experiment 22 Physical and Chemical Constants of Drugs
    (Multi—designing Experiment)
附录(Appendices)
常用物理化学数据表(Reference Data of Experimental Physical Chemistry)
参考文献(References)
编辑推荐
《卫生部"十二五"规划教材•全国高等医药教材建设研究会"十二五"规划教材•全国高等学校药学专业第七轮规划教材:物理化学实验指导(双语)(第2版)(供药学类专业用)》由崔黎丽主编,为全国高等学校药学专业第七轮规划教材物理化学的配套教材。
章节摘录
版权页: 插图: (4) If the leading digit is equal to or greater than 8,increase the number of significant figure by one. For example,we can take the number of 9. 15 as 4 significant figures in calculation. (5) In addition and subtraction, retain as many decimal figures as are given in the number having the fewest decimals. In multiplication and division, the result should be retained to have the same number of significant figures as in the components with the least number of significant figures. 5. Data reporting Most commonly, the data obtained in physical chemistry are presented in the form of tables, graphs or equations. 5.1. Tables After experiment, organize the data observed into a table according to the relationship between independent variables and dependent variables. It is easy to creat a table and make comparison among a list of data. The primitive data are commonly presented in a table. There are some guidelines for creating a good table. ( 1 ) The table should have a title that provides a short description of the table's purpose. (2) The columns and rows should be labeled and the physical name and units must be indicated. ( 3 ) The data reported in table should be in their simplest form. If a same power of ten is used, it should be indicated in the column heading. (4) The decimal point of the numbers in a column should be aligned. (5) In general,the condition of experiment or surroundings should be specified in table,such as room temperature, atmospheric pressure, date and time of the measurement. Presenting the data in the form of table holds the advantages of simple. It is easier for comparison and reference. The raw data from the experiment are usually given in the form of a table. 5.2. Graphs 5.2.1. Use of graphs The use of graphs in presenting experiment data is called graphic methods. Graphing techniques are very useful in experimental physical chemistry mainly to (1)give a pictorial presentation of the variance regularity of the data; (2) reveal maxima, minima, inflection points,or other significant features ; ( 3 ) perform direct differentiation by drawing tangents to a curve,accomplish integration, and so on. Some examples of uses of graphs are as follows. ( 1 ) Interpolation method Use the raw data from the experiment to plot the graph. The curve shows the relationship between dependent variable and independent variable. An intermediate value of one variable (dependent or independent), can be obtained from the curve. For example, in drawing a phase diagram of a binary liquid system of cyclohexane and ethanol, the composition of vapor and liquid at equilibrium are obtained by interpolation method.
图书封面
发布书评
精彩短评 (总计3条)
-
 书很好,比学校的实惠!!!
 -
 很新的课本,是我们说要的
 -
 参编者怎能随意改动
